London Property Market Report 2026

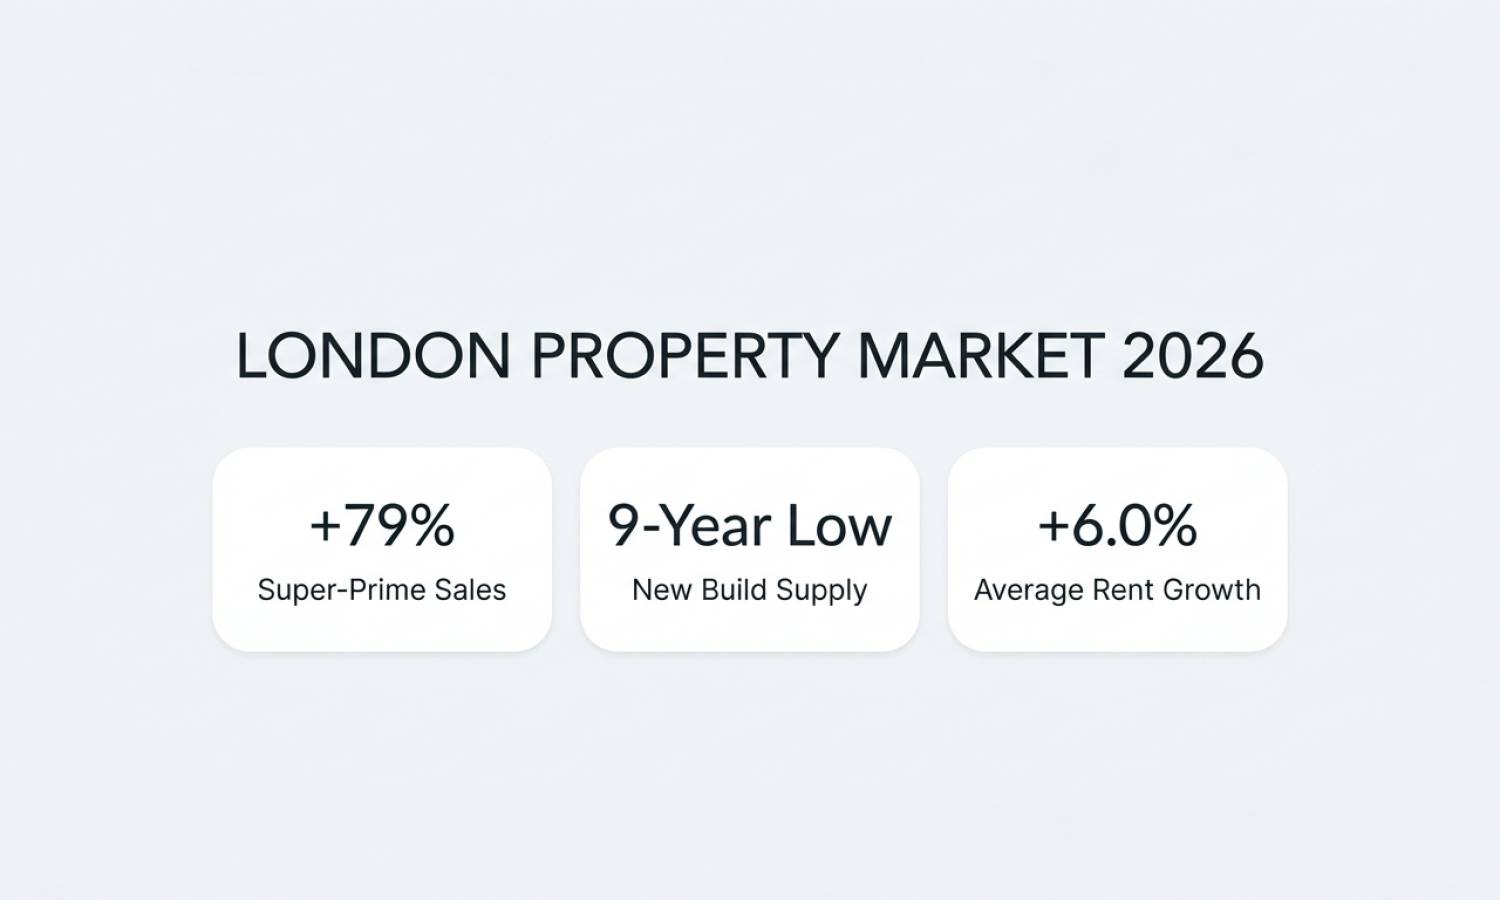
London's property market in 2026 does not move as a single unit. It never really did, but the divergence this year is sharper than at any point since 2016. Ultra-prime transactions above £15 million have surged 79% by value in the first half of the year. New build starts have hit their lowest level since 2017. Average rents are up 6% year-on-year while overall sales volumes have dropped 6 to 9% against 2025. A new Prime Minister has taken office with housing as a declared priority.
This report pulls together the full picture as of August 2026: prices by segment, rental market conditions, new build supply, mortgage rates, international buyer flows, and the policy environment ahead. It is designed as a reference document for buyers, investors, landlords, and anyone tracking the London market through the second half of this year.
1. House Prices: London Lags the National Average
At the national level, UK house prices recorded modest annual growth of approximately 1.3 to 1.5% in the first half of 2026. London has consistently underperformed this figure. Several indices recorded year-on-year price declines in the capital, making London the only English region to register negative monthly price growth in recent reporting periods.
The July 2026 Rightmove House Price Index recorded a 1.0% month-on-month drop in average asking prices nationally, steeper than the seasonal norm. In London, where properties are already priced at a significant premium relative to mortgage affordability, buyer sensitivity to pricing is more acute than in lower-value markets.
Key Price Data Points (August 2026)
| Segment | Trend (YoY) | Key Dynamic |
|---|---|---|
| Greater London (All) | Flat to -1% | Lowest sales conversion rate in England (35.8% reach SSTC) |
| Prime Central London | -1.7% (Q2 2026) | Still ~15% below 2014 peak. Average discounts ~10% |
| Super-Prime (£15m+) | +79% by transaction value (H1 2026) | US and Gulf buyers. £1.24bn transacted H1 2026 |
| £5m+ Segment | +13% (Q2 YoY) | £1.22bn spent in Q2 2026 alone |
| Flats / Apartments | Weakest sub-segment | Cladding concerns, investor contraction, mortgage sensitivity |
| Outer London Family Homes | Most resilient sub-segment | Elizabeth Line connectivity driving sustained demand |
London's highest-value market and its mainstream market are moving in opposite directions for the first time in the post-pandemic era. Available supply is at its highest level in over a decade for this time of year according to Rightmove, giving buyers more negotiating room than at any point since 2017. In some prime central postcodes, time to reach Sold Subject to Contract exceeds 200 days.
2. New Build Supply: A Nine-Year Low
The London new build sector is experiencing one of its most constrained supply environments in a decade. In Q1 2026, only 6,325 private-sale homes broke ground in the capital. Against an annual requirement estimated at approximately 90,000 new homes per year to meet population and household formation demand, this figure represents just 7% of what London needs in a single quarter.
Developers have responded to a combination of pressures by pulling back sharply:
- Viability: Construction costs for materials including steel, cement, and glass have remained elevated after the inflationary cycle of 2022 to 2024. Labour costs have not fallen in line with expectations.
- Unsold inventory: Average months of supply across London new build developments sits at approximately 29 months. In some prime inner-London boroughs, unsold stock represents more than 10 years of supply at current absorption rates.
- Sales rate pressure: Developers need pre-sales of typically 60 to 70% before securing development finance. Achieving those pre-sales at acceptable margins has proven difficult in many schemes.
- Future pipeline: Planning consent levels are insufficient to sustain the current volume of completions once the existing pipeline clears, implying structural supply tightening over 2027 to 2029.
For buyers, this dynamic creates a short window. Developments that are currently discounting or offering incentives to clear stock will not be in the same position once the pipeline contracts further. The new builds in London currently available represent the tail end of a supply peak, not the beginning of a new one.
3. The Rental Market: Strong Demand, Structural Shift
London's rental market has held firm through the same conditions that have softened sales. Average private rents in the capital reached approximately £2,207 to £2,300 per month in summer 2026, reflecting annual growth of 6.0%, one of the strongest rates in the UK.
Rental Data by Location (Summer 2026)
| Location | Avg Monthly Rent | Notes |
|---|---|---|
| Kensington and Chelsea | £3,596 / month | Highest average in Greater London |
| Zone 1 Prime (Mayfair / Marylebone) | £2,600 - £3,200+ / month | Studio to 1-bed. Executive and corporate demand |
| Greater London Average | £2,207 - £2,300 / month | +6.0% YoY, all tenancy types |
| Outer Boroughs (Zone 3-4) | £1,300 - £1,500 / month | 1-bed. Strong demand from first-time renters |
| Top Rental Yield Corridors | 5.2% - 6.8% gross | Stratford, Barking, Ilford, Croydon, Walthamstow |
Three structural forces are sustaining rental demand. First, elevated mortgage rates are keeping potential first-time buyers in the rental market for longer. Second, the Renters' Rights Act, which came into force in May 2026, has accelerated the exit of smaller private landlords from the sector, reducing available stock. Third, population growth and the continued concentration of professional employment in London sustains a tenant base that consistently outpaces supply.
Build-to-Rent operators are the clearest beneficiary of this environment. Institutional stock with professional management is absorbing demand that exiting private landlords are no longer serving. Buyers using rental income to underwrite investment decisions can explore neighbourhood guides on this site for zone-by-zone breakdowns.
4. The International Buyer: Profile Shift and New Capital Flows
The international buyer in London in 2026 looks different from five years ago. The non-domiciled resident optimising for tax efficiency has largely been replaced by the lifestyle and capital-preservation buyer: typically based in New York, Riyadh, Dubai, or Shanghai, purchasing London real estate as part of a global portfolio.
- US buyers now account for approximately 30% of all London transactions above £5 million, up from 20% at the end of 2025. Driven by dollar strength and London's discount relative to New York and Miami.
- Gulf buyers represent approximately 25% of ultra-prime transactions, focused on Mayfair, Belgravia, and Knightsbridge. Motivation is capital preservation and family-base establishment.
- Total foreign-owned residential stock across England and Wales is estimated at £84.2 billion, with London accounting for more than half.
- Super-prime H1 2026: £1.24 billion in transactions above £15 million, up 79% by value year-on-year. £1.22 billion transacted at £5 million-plus in Q2 alone, up 13%.
For sellers and developers targeting international buyers, the international buyer guide covers current SDLT rates, ownership structures, and the practical steps for non-UK residents completing a London purchase.
5. Mortgage Market: The Base Rate Illusion
The Bank of England voted 6 to 3 on 30 July 2026 to hold the base rate at 3.75%. Three committee members voted for an immediate increase to 4%. Within days, major lenders including Nationwide, HSBC, and TSB raised their fixed-rate mortgage products.
Fixed-rate mortgages are priced from swap rates, the wholesale rates at which lenders fund fixed-term commitments, not from the Bank Rate itself. As geopolitical tensions pushed oil toward $100 a barrel and reignited inflation concerns, swap rates trended upward through July and into August across two, five, and ten-year terms.
| Product | April 2026 Peak | August 2026 | Direction |
|---|---|---|---|
| 2-year fix (75% LTV) | ~5.0% | ~4.6-4.8% | Rising from summer low |
| 5-year fix (75% LTV) | ~4.8% | ~4.4-4.6% | Rising from summer low |
| BoE Base Rate | 3.75% | 3.75% | Held. Next decision 17 September |
Buyers looking at off-plan property have additional flexibility: exchange at today's price, with mortgage draw-down 12 to 24 months later when rates may have moved in either direction.
6. Policy Environment: What the Burnham Government Means for Property
Andy Burnham became Prime Minister on 20 July 2026. The Autumn Budget 2026 is the first realistic vehicle for substantive policy announcements. Key signals and market implications:
| Policy Area | Current Status | Potential Market Impact |
|---|---|---|
| Stamp Duty Reform | Under discussion. No change yet. | Reform could unlock significant transaction volume and trigger demand surge before new supply arrives. |
| Land Value Tax | Proposal only. Multi-parliament timeline. | If implemented: pressure on landbankers to build, accelerating supply pipeline. Long-term bearish for speculative land holding. |
| Council Housebuilding | Commitment confirmed. Scale TBC. | Addresses social housing shortfall. Limited direct competition with private new build market. |
| Renters' Rights Act | In force since May 2026. | Landlord exits accelerating. Rental supply falling. Build-to-Rent gaining market share. Rents rising faster than pre-reform forecasts. |
| Planning Reform | Committed. Implementation 2027+. | Supply benefit likely 2028 onwards. Stalled sites could unlock in 12 to 18 months. |
7. Borough-Level Market Conditions
Fastest-selling outer boroughs (under 60 days to SSTC): Bromley, Havering, Sutton, Barnet. Family house demand has held up better than any other sub-segment.
Longest time on market (200+ days to SSTC): Parts of Kensington and Chelsea, Westminster, and the City of London. Sellers face extended negotiation periods with asking price reductions averaging 10% or more.
Strongest rental yield corridors: Stratford and Newham (E15/E16), Ilford and Barking (IG/RM), Croydon (CR), and Walthamstow (E17) consistently show gross yields between 5.2% and 6.8% on new build stock.
Capital growth corridors (3 to 5 year view): Areas directly served by the Elizabeth Line with planned cultural or educational infrastructure anchors: Stratford, Hayes, Woolwich, and Abbey Wood show the strongest forward indicators from current pricing levels.
8. The New Build Investment Case in 2026
The investment case for London new builds in 2026 concentrates around three arguments:
- Supply contraction is structural, not cyclical. With only 6,325 private starts in Q1 2026, the pipeline of completions beyond 2027 is already shrinking. Lower future supply into sustained demand is a price-supportive dynamic.
- Current pricing reflects buyer caution, not fundamental weakness. Sellers are discounting. Developers are offering incentives. The negotiating environment for qualified buyers is the most favourable in five years. These are late-cycle conditions, not early-cycle.
- Rental income underwrites the holding cost. At 5.2 to 6.8% gross yields in outer London new build corridors, rental income covers mortgage costs at current rates for buyers with a standard 25% deposit.
Buyers evaluating off-plan property have the option of buying at today's pricing with completion into a potentially better rate environment, while shared ownership homes provide a lower capital entry point for buyers who cannot yet fund a full mortgage on an open-market new build.
9. Outlook: H2 2026 and Beyond
Three decision points will shape the London market through year-end and into 2027:
17 September: Next MPC Decision. With three members voting for an immediate hike in July, any shift in the inflation picture could produce the first rate increase since 2023. Mortgage pricing would respond within days.
Autumn Budget: Policy Announcements. Stamp duty reform, planning changes, and new first-time buyer support mechanisms are all in scope. A positive policy surprise could release pent-up demand quickly.
Supply Pipeline Normalisation (2027 to 2028). The current low-start environment means fewer completions in 24 to 36 months. Buyers who act in H2 2026 are purchasing ahead of this contraction.
London's property market in 2026 is not in crisis. It is in the middle of a structural reset from an era of cheap money and speculative momentum to one defined by genuine yield, realistic pricing, and supply discipline. The buyers and investors who understand that reset are finding opportunities. Those waiting for 2021 conditions to return are likely to wait a long time.
About This Report
This London Property Market Report 2026 was produced by 1newhomes.com, an independent new homes portal covering new build developments across Greater London and the UK. Data sources include Rightmove House Price Index, Zoopla Market Reports, JLL Residential Research, Savills Prime London Reports, Knight Frank International Residential Research, Bank of England MPC minutes (July 2026), and Greater London Authority housing data. All figures reflect market conditions as of August 2026.